


Housing impacts so much of the economy. The numbers vary slightly, but experts say housing, as a whole, makes up about 20% of the GDP of the U.S. when you account for building materials and construction workers and renovations and moving costs and taxes and real estate agents and title companies and repairmen and appliances and Zillow advertising.
It also has an entirely different incentive structure than the stock market (my favorite market). Unlike buying stock in a company, buying a house one day and selling it the next is not a great idea (actually, that’s not a great idea for stocks either, but it’s certainly easier). So, as an investment, a house gives you a bit of diversification and just enough friction to let it appreciate in value.
I can’t see the price of my house every day from 9:30am to 4:00pm while the market is open. It’s also a forced mechanism for saving money. I have to pay my mortgage every month.
And, oh yeah, it gives me a place to spend time with loved ones and eat breakfast and sleep, I guess.
Not everyone wants a house, though, and that’s okay. Some people love the freedom of renting. Some people can’t afford one. Some people prefer traveling and staying in AirBnBs for years on end. You do you.
But for the 66% of Americans who own homes, or for those interested in buying one, here are 10 current charts that help explain where we’ve been, how we got here, and possibly where we’re headed:
Mortgage Interest Rates
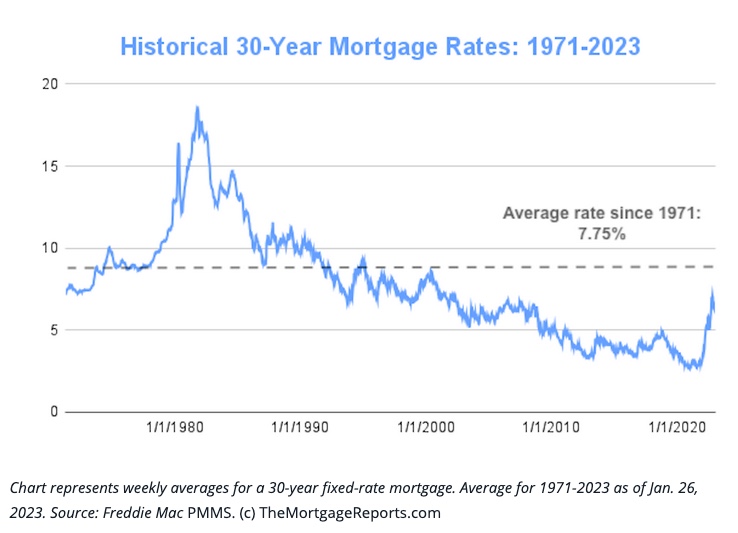
Mortgage interest rates are important to this story. Real important. That’s because they are the rate you will pay to the bank on the money you borrow to buy the house. Most people do not pay cash for their homes and so they will get a mortgage with an interest rate. Mortgage rates go up and down a little bit each day. Over the course of a year, rates can increase or decrease a lot.
As you can see above, mortgage rates have doubled over the past year from 3-4% to about 6-7%. They are still historically low, but housing prices are historically high so it kind of cancels out.
To put this in context, a $300,000 house with 20% down payment in August 2021 would have cost you $1,322 every month (with a 3% mortgage). Today in February 2023, that same priced house with the same amount of down payment will cost you $1,749 each month (with a 6% mortgage).
That’s a big difference: $427 to be exact. For that much money, you could buy 85 coffees from Starbucks each month! Or two shares of Tesla! Or a dozen eggs!
Theoretically, house prices should come down when interest rates go up to maintain some equilibrium. Unfortunately, homeowners that locked in 3% or 4% rates are not going to trade in those rates anytime soon unless they are forced to move. This brings us to our next two charts: existing home sales prices and volumes.
Existing Home Sales Price
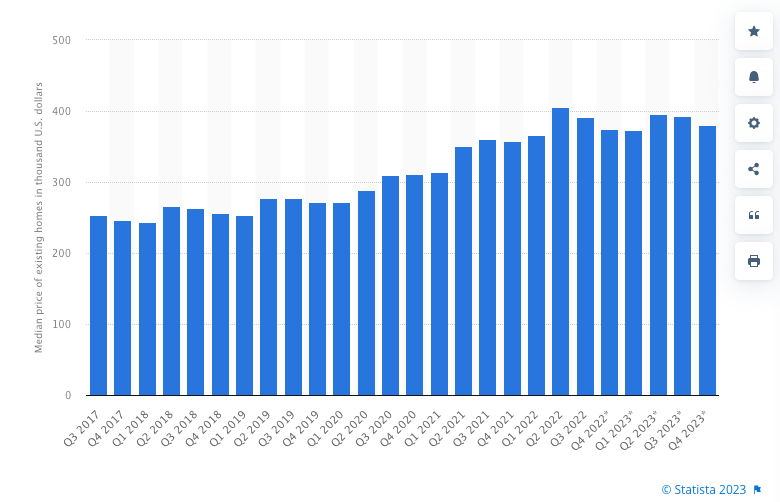
Existing home sales prices have not dropped meaningfully. In fact, the only places prices have dropped are the places where prices rose the most over the past few years – mainly places like Tampa, Austin, Boise, and Las Vegas.
Less desirable locations during the pandemic did see meaningful home price appreciation, but not nearly to the level of the popular pandemic cities, so their prices have not dropped nearly as much. Many have simply maintained the same level for the past year.
Existing Home Sales Volume
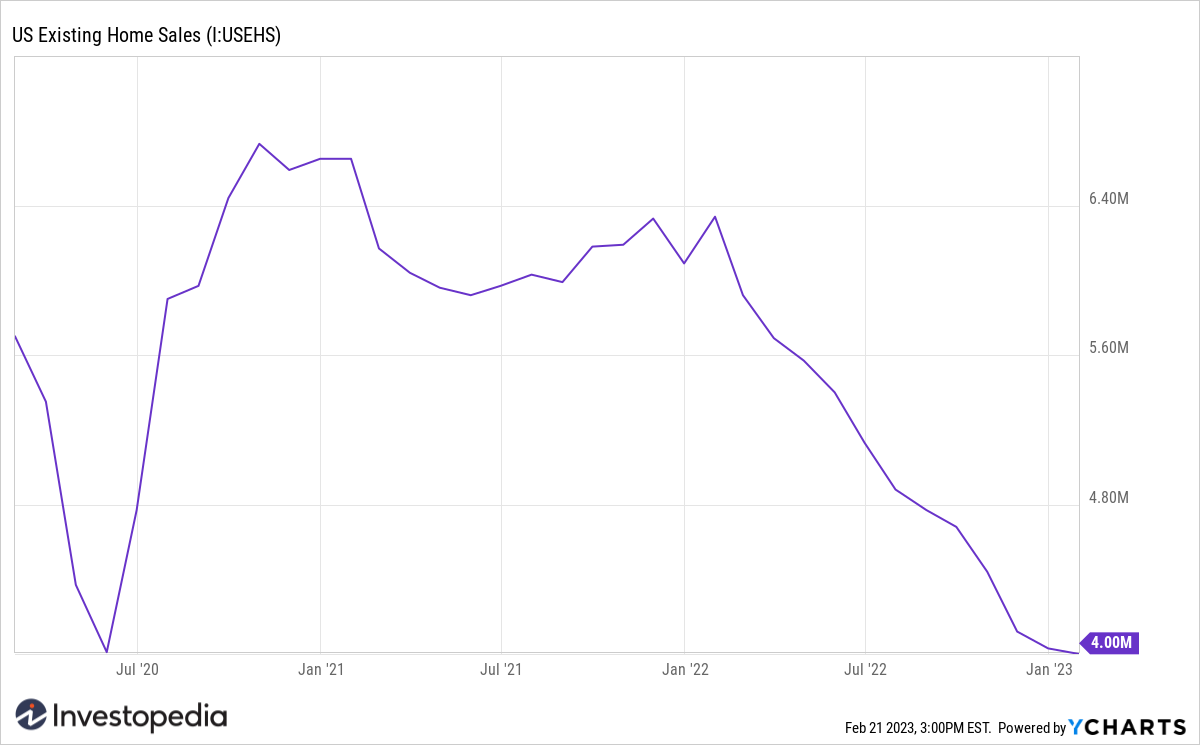
Relatedly, the volume of home sales have dropped to their lowest level in years. Simple supply and demand will give us the most obvious conclusion – prices are not yet going to drop because supply is still limited and demand is still high.
Back in Spring 2020, existing home sales also dropped but for an entirely different reason – no one could leave their house due to COVID.
Now, housing activity is essentially in a tug-of-war where each side won’t budge. No one wants to sell at a lower price and no one wants to buy at a higher rate. We have an anchoring bias going on across the country.
“But why is there still so much demand?”, you may ask. For one big reason, let’s look at our next chart: Demographics.
Demographics
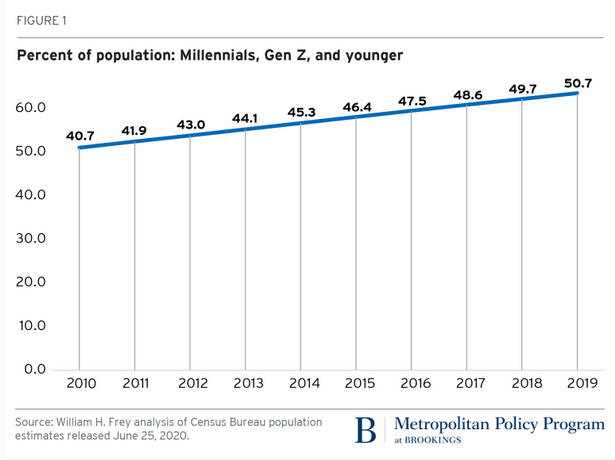
In 2019, something very important happened. The percent of people in the Millennial and younger generations (Gen Z and the yet-to-be-named Gen) crossed 50% of the entire U.S. population for the first time. Why is this important?
As people age, they tend to do two things (besides complain about their backs and the cost of eggs): they form households and they earn more money.
Millennials have entered both their prime earning years and their prime family-starting years. This puts a lot of pressure on the existing and new home supply as these folks settle down and need more space than an apartment.
But as we’ve seen above, no one wants to sell their house, so the demand and supply problem is further exacerbated putting the price of a home too high for most first-time-home buyers.
So, we should just build more houses right? If only it were that easy – let’s look at our next two charts: New Housing Supply and the Prices of New Homes:
New Housing Supply

An estimated 644,000 new homes were sold in 2022. This is 16.4 percent below the 2021 figure of 771,000. Obviously, interest rates played a big role in the increase and subsequent decline. But, no matter the cause, the effect is less homes being built because there are less buyers at these high rates. And the precious few homes that are getting constructed? Just look at the price of them:
New Home Prices

The share of houses being built for less than $200,000 is essentially zero. Homebuilders don’t see any profit in them. So first-time home buyers are looking at a majority of homes above this price.
In fact, the majority of houses being built today (over 50% of them) cost more than $400,000! This is because they are bigger and nicer and have higher profit margins so builders prefer them. Also, labor costs are really high.
Labor is a high cost because we have so few trades workers since everyone was told to get a 4-year degree over the past 3 decades. Now plumbers and electricians command 6 figure salaries and ChatGPT is going to replace all the knowledge workers you know.
If you are one of the lucky few who can afford to buy new, don’t forget these 15 Questions to Ask When Buying a New Construction House.
Another interesting factor in the price of homes is related to the other place we spend a majority of our time: the office. Take a look at this chart, courtesy of Kastle Systems:
Office Occupancy Rates
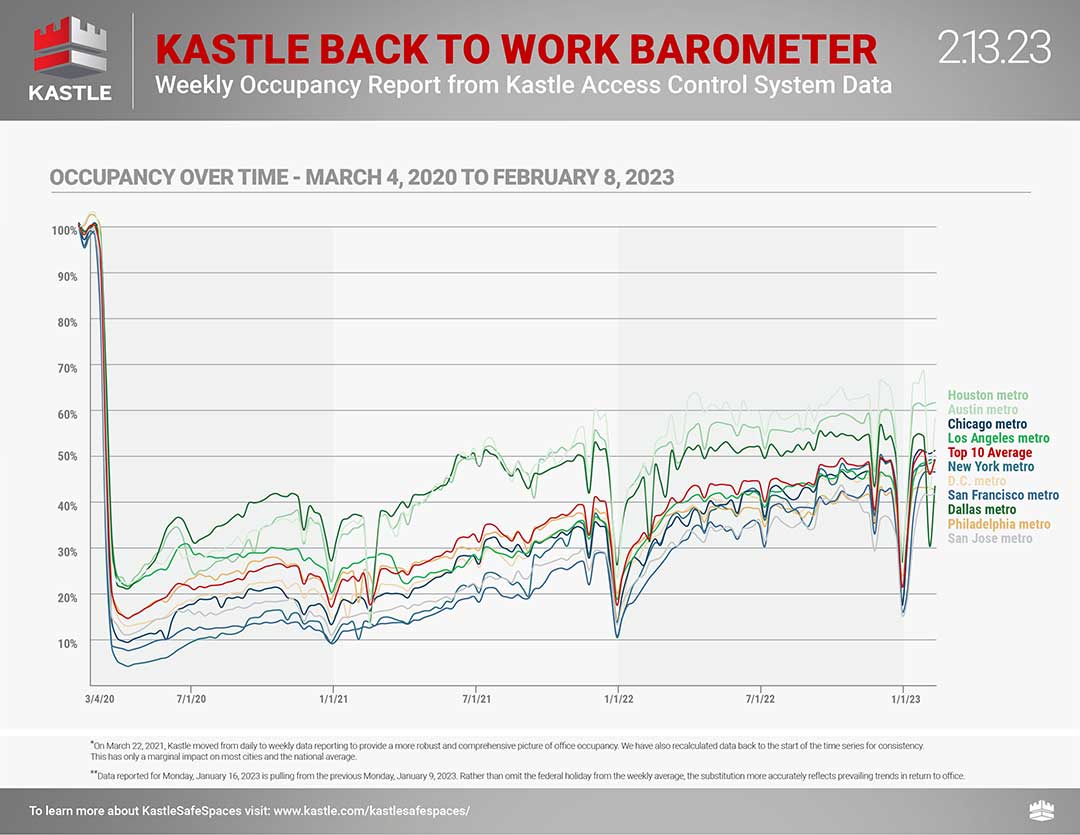
With office occupancy still hovering around 50%, many workers continue to work from their home some or all of the time. Working from home requires space and amenities which puts upward pressure on demand for houses which causes prices to remain elevated.
Let’s now turn to credit card debt to see if the consumer is under strain:
Late Credit Card Payments
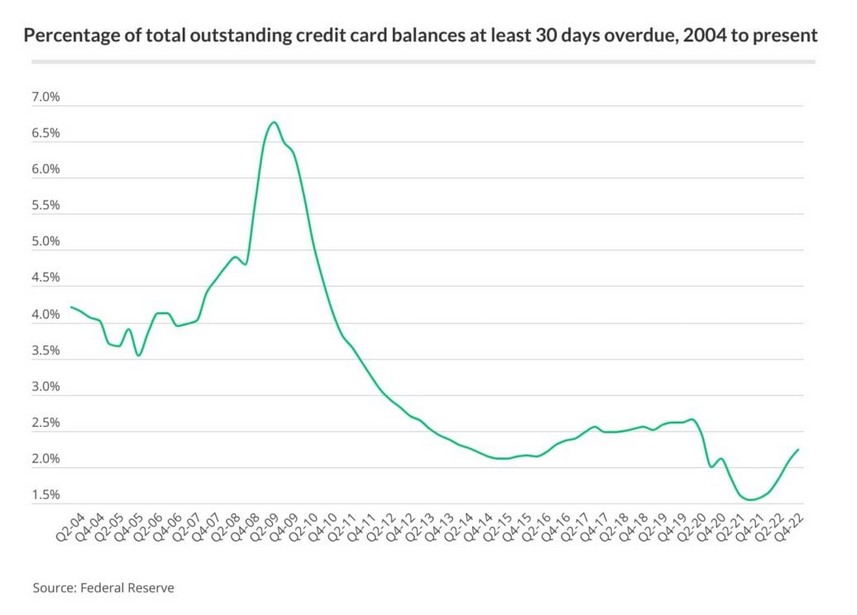
For all the talk of layoffs and recessions in the headlines over the past 12 months, it sure isn’t showing up in the data. Consumers are having no problem paying their credit card balances. Overdue credit card loans are still very low compared to the previous economic boom and bust (the global financial crisis).
This is a great leading indicator to watch for the health of the consumer. If they can’t pay back their credit cards, they may begin to default on their mortgages, too, which would force them to sell their homes which could lower prices due to excess supply.
To see when that could happen, we need to look at how much cash average Americans are holding.
Excess Savings
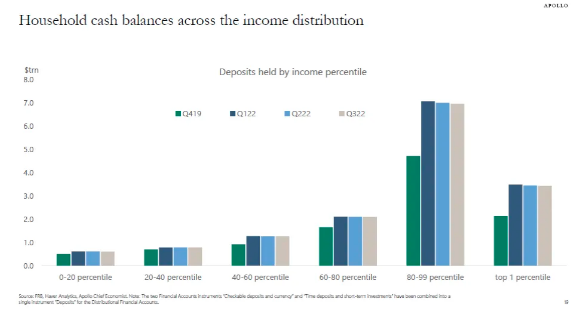
No matter their income, Americans have a good deal more cash savings last year (tan bars) than they did in 2019 (green bars). It has dropped only a minor amount for the wealthiest and stayed high for the poorest percentiles.
Finally, let’s look at U.S. rental prices, as renting is the most likely alternative to buying a house, right ahead of moving in with relatives:
U.S. Rental Prices
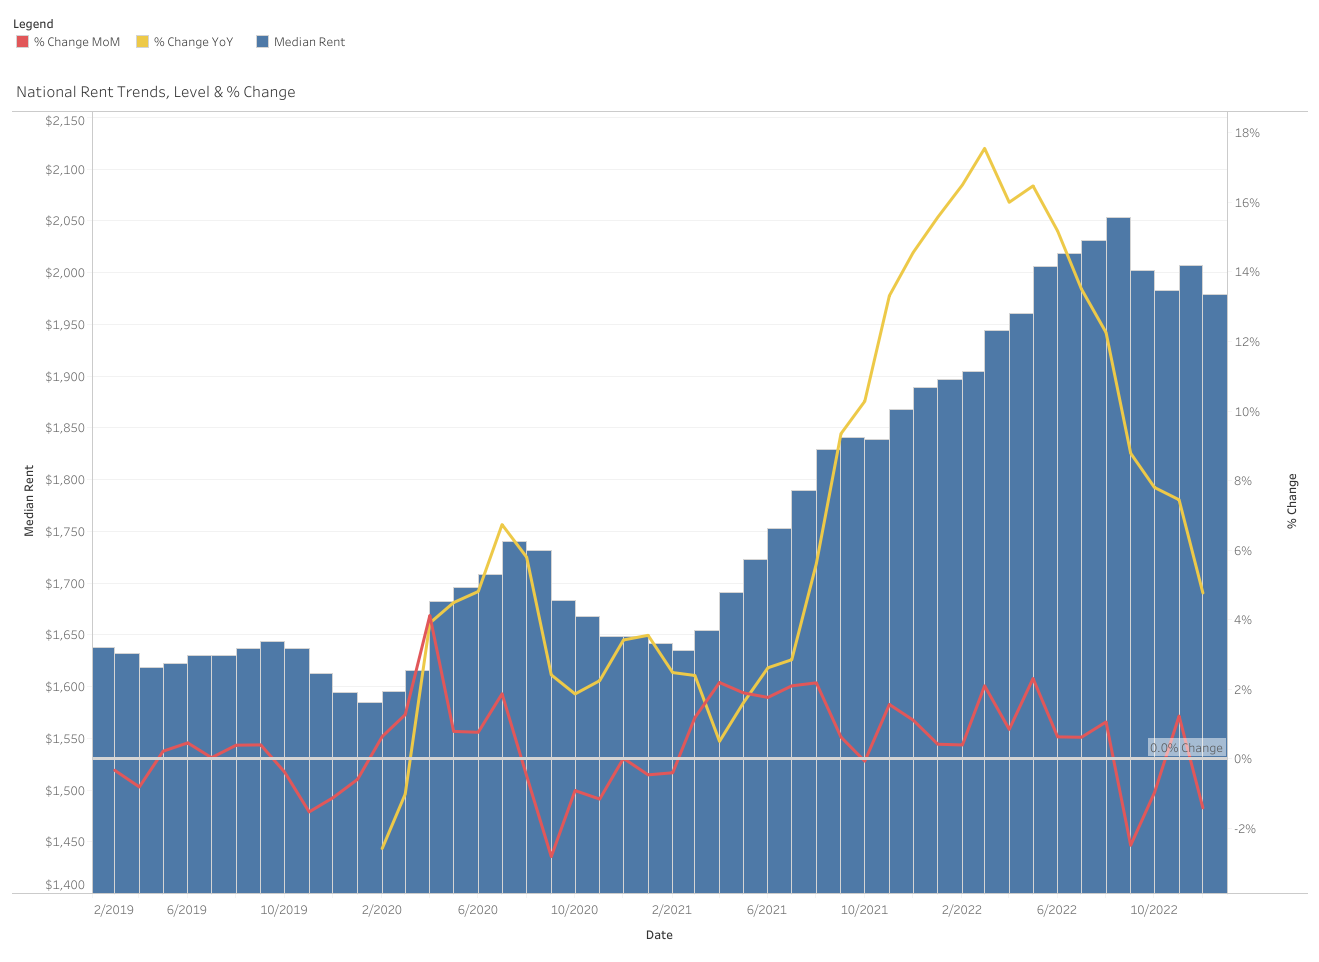
Finally, some respite for non-homeowners. It feels like we just covered 9 charts going in the wrong direction for someone looking to buy a house, but average rent prices are quickly decelerating which should allow renters to save more.
If you do rent, check out my free comparison tool for looking at apartments!
These charts are interesting, and the trend is definitely not in favor of first-time homebuyers, so what can you do personally to alleviate this structural problem? I don’t recommend waiting for the government to come out with any sort of assistance program, as that will simply increase demand and, therefore, prices.
Here’s some alternatives that are in your control:
What First-time Buyers can do about this Difficult Housing Market
If you don’t own a home, use all my tricks to save money and put your savings in an online savings account. Do not invest it in the stock market, crypto, or your friend’s great idea for mail-order goldfish. With online savings accounts paying 3.75% or more, your cash can finally earn you a decent return while you wait for the right house.
Maintain a high credit score so you get the best rates on loans. A credit score above 720 will allow you to get lower interest rate loans than sub-720 scores.
Opt for a 15 year mortgage and a cheaper house to get an even lower interest rate.
Ask the seller (or builder) to buy a “discount point” for your loan which equals a 0.25% reduction. Or buy points yourself. One discount point costs about 1% of the home price. So, for a $300,000 loan, you can lower the interest rate of the mortgage 0.25% by paying $3,000. Over the lifetime of the loan, you will save a lot more than $3,000 using this method. But only if you stay put for awhile.
Ask for a raise. With record low unemployment, employers are hoarding employees and may want to keep you around rather than go through the hassle of replacing you. A higher paycheck will speed up the process of saving for a house.
Or buy a house, cross your fingers and hope for a drop in interest rates so you can refinance at a lower rate in a few years. It’s always an option but it’s never guaranteed to work out.
Whatever you do, good luck and thanks for joining me on this exploration of the data. Your results will vary!
More reading:

What Is a Buyer-Agent Agreement – And Why It’s the Smartest Move You Can Make When Buying a Home
Buying a home is too big of a decision to go it alone or leave it to chance. That’s where a Buyer-Agent Agreement comes in.

Keeping Up with Yourself
Keeping up with yourself can be a great fuel—and an even greater trap. The art is knowing when to press forward, and when to simply be where you are.
(5 min read)

Why You (and I) Need a Career Coach
I messed up at work but survived — thanks to my career coach. Spoiler alert: British football analogies included.


You must be logged in to post a comment.